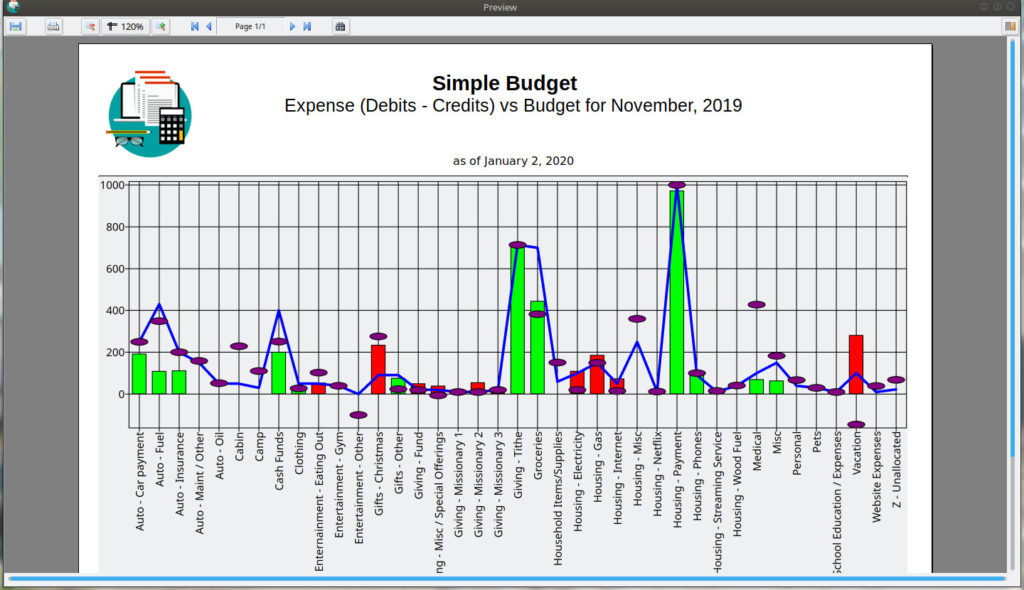
Simple Budget V2.2.6 has been released. This update has a few nice upgrades plus a lot of smaller adjustments and fixes.
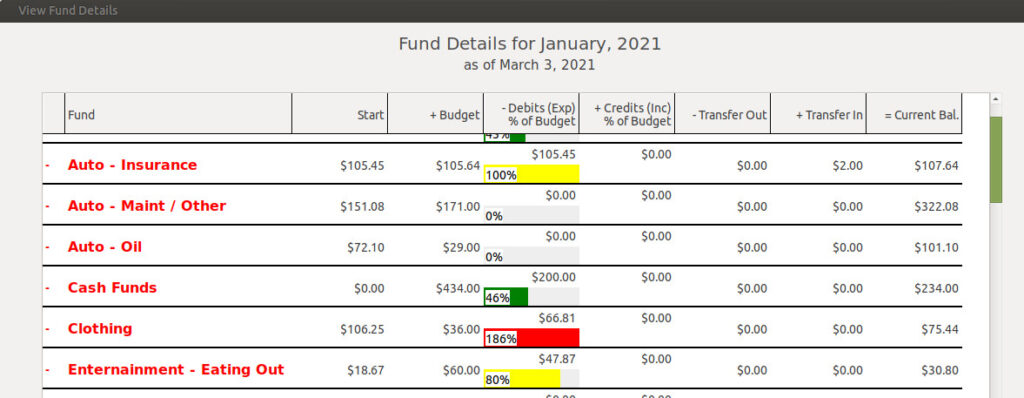
The first upgrade to show is visible in the “View Fund Details” report. As seen in the screenshot above, I’ve added a small bar graph for each fund. The bar graph measures the percent amount of the monthly budget spent or deposited in the current month. For expenses, the bar graphs are color coded. If the amount spent is below 75% of the monthly budget, the graph is green. From 75% to 100% the graph is yellow, and if the amount spent is greater that the monthly budget, the color is red. Overspending a monthly budget is not necessarily bad, for example, if you have been saving for several months for a purchase, then make the purchase, the amount spent will be above the monthly budgeted amount. That is ok. The color codes will help you look at a quick glance at those expenses and help you decide if they are ok or not. All deposit (Income Funds) graphs are green.
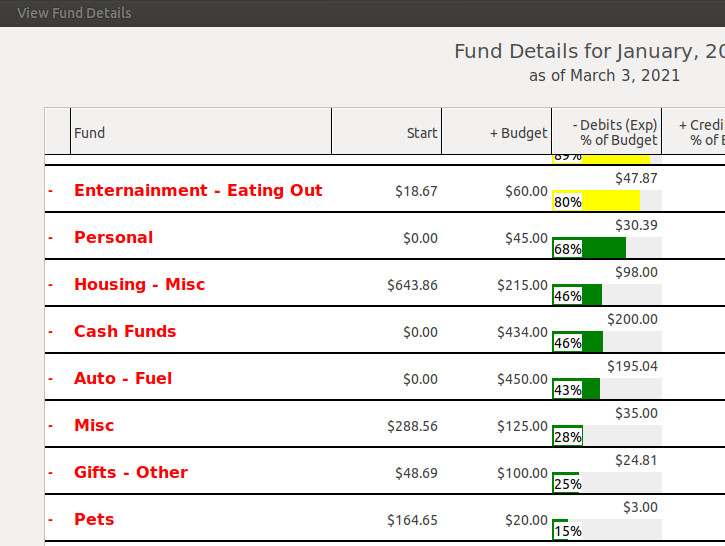
I’ve also added a “Sort Exp %” button which will sort the funds by the greater percent to lower as seen in the screenshot above. This way, you can see, from greater to less, at a glance, which fund spending you might have to keep an eye on during the month.
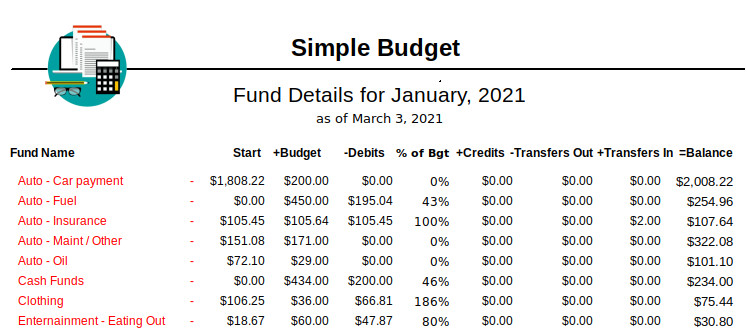
The printed report includes and additional column next to the -Debits (Expense) column that shows the percent spent of the monthly budget. The report does not show the percent amount for Income funds. The report will print in the sort order selected.
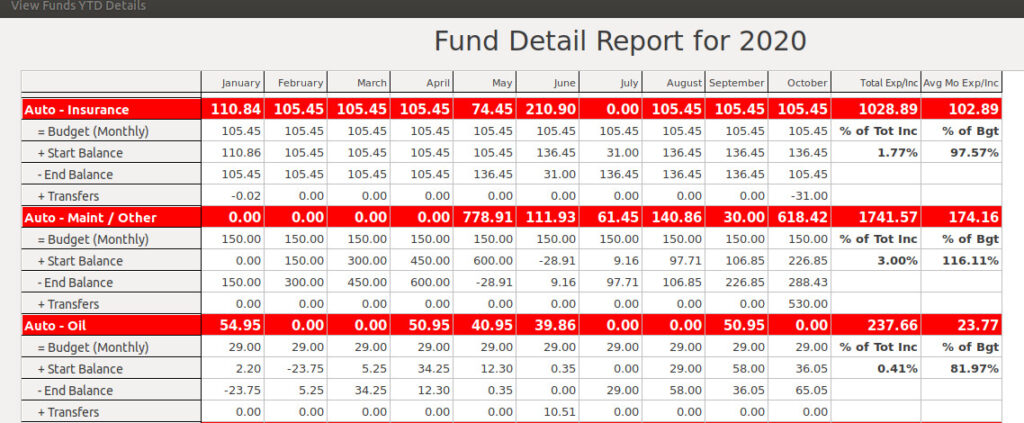
The next major addition to V2.2.6 of Simple Budget is in the “View Funds YTD Details” report. I’ve added information in last two columns as shown in the screenshot above. These two columns can be used at the end of the year to see if any Fund’s monthly budget amounts might need to be adjusted for the next year. It can also be used all during the year to see how actual spending compares with budgeted.
In the “Total Exp/Inc” column, I’ve added two lines indicating the percent that this fund has spent (or deposited) of the total of all the Income Funds. This will help if you want or need to keep a particular fund below a certain percent of total income.
In the Avg Mo Exp/Inc column, I’ve added two lines indicating the percent of the Average Monthly Expense of a fund compared to the current budgeted amount for the fund. If the budget has been laid out properly, the percent of the “Average Expense” should be less than 100%. If you find that, on average, your expenses for a particular fund are greater than 100% of the budgeted amount, you may have to look at your spending habits, or make adjustments to your budgeted amounts. If a certain fund consistently has a low percentage, you may be able to lower the Budget Amount for that fund and place the excess amount in a more needed fund. As with any other report, this is only a guide. There may be situations that you know an average percent will be low or high, such as saving long term for a purchase, or a periodic purchase that has had be made knowing there won’t be another one for some time. These are just tools available to help you along. They help me, so I put the in Simple Budget.
You can see more detail about all of the changes and bug fixes in this version on the Change Log page.